Thank you for the analysis! I am surprised too on the relatively small numbers. :)
I didn't do any ROM or RAM usage tests. I assumed if I ever overstep my boundaries the simulator would inform me (or something would go horribly wrong visually).
Speaking of RAM, I was very casual with creating static variables. A lot of temporary variables that required memory alloc was allocated at init time, and thus they were defined as static variables on class level. This is quite wasteful; because a lot of them truly are there for one or more instructions, and could be reused elsewhere at other parts. But on the other hand, I didn't want to deal with possible memory collisions.
Another wasteful part is how I represent float numbers. I allocate an entire 16-bit wide integer for a single sign bit, and another integer for the exponent, which never grows beyond the hundreds in magnitude. The two could be stored in a single int, but then you'd need extra instructions to separate them in every float related calculations.
I did a quick investigation with cProfile on the Python code with my custom float design. It seems that float addition was the most frequent function call (79,585,262 times!), followed by multiplication (39,208,095 times), substraction (27,256,770 times) and division (16,984,750 times). This does not count Python integer multiplications though.
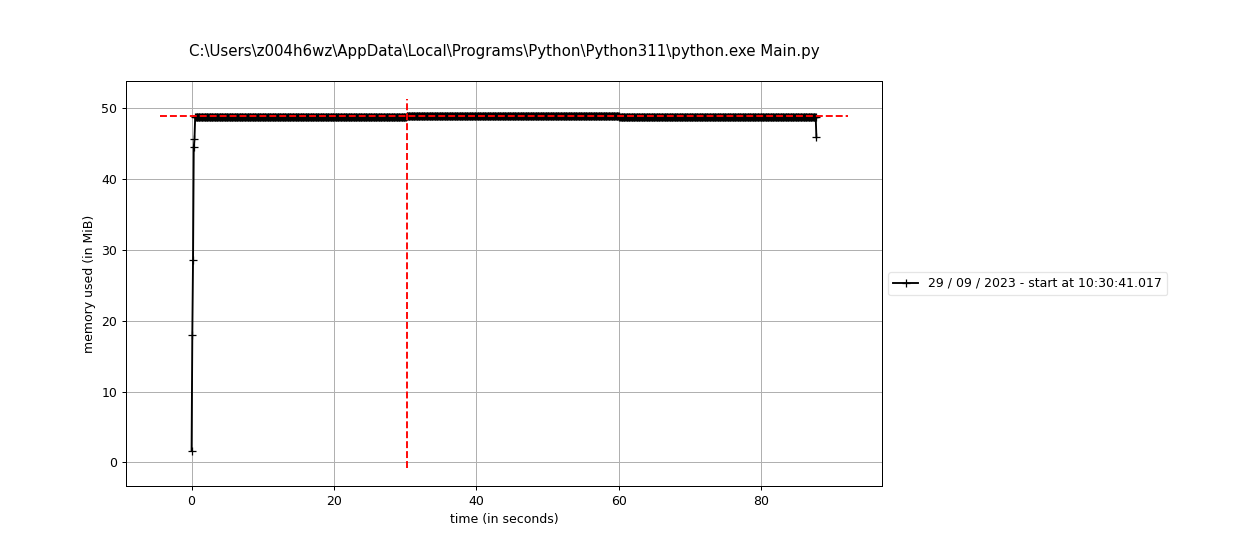
memory_profile showed me this plot:

Yeah, constant. :D The minor ups and downs I assume is because of the Python variables, not my manual allocs.

